“Most definitions of self-serve analytics are both vague and vaguely tautological”
I totally agree with this statement from Benn in Self-serve is a feeling – by Benn Stancil. I’m annoyed when people argue about what is considered self-service and what does not.
So before we delve into self-service BI and its future, let me use a food-serving industry analogy to align us on the definition of self-service in general.
- Is ordering food from a tablet self-service?
- Is buffet self-service?
- Are meal kit delivery services, where people have to cook themselves, self-service?
Would you consider all of these options as self-service? I certainly would.
Self-service means allowing customers to achieve something without requiring assistance from a service provider, while they used to require it in the past.
Self-service can happen in any stage of a process where there are Customers and Service Providers involved. The key benefit of self-service is that it offloads the workload from the service provider to its users. This leads to a reduction in the cost of operations and communication and an improvement in the scalability of the system.
So what is Self-service BI and the problem it is trying to solve?
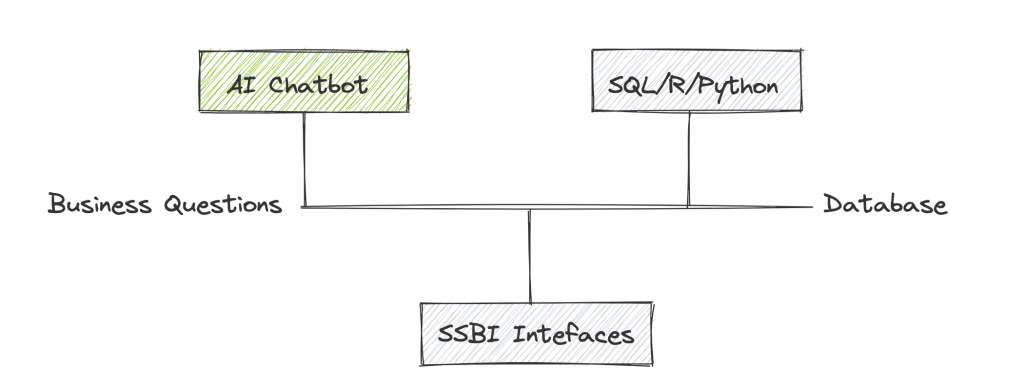
The BI Black Box
BI is about helping business make better decision by answering business questions using data, including the process of collecting, analyzing, and presenting data.
Using the Black Box Model, we can conceptualize BI as a process that takes business goals and data as inputs and produces decisions as outputs.
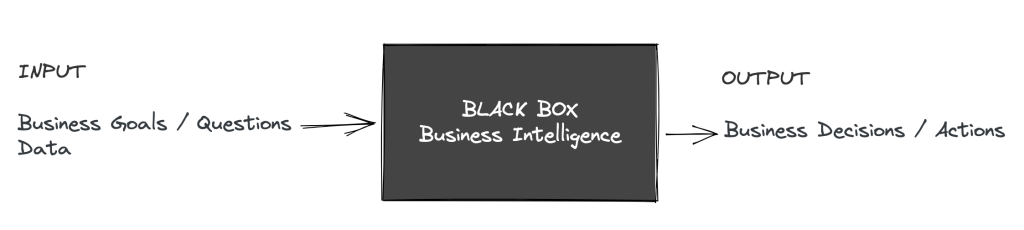
Uncovering this black box, below is a typical workflow inside
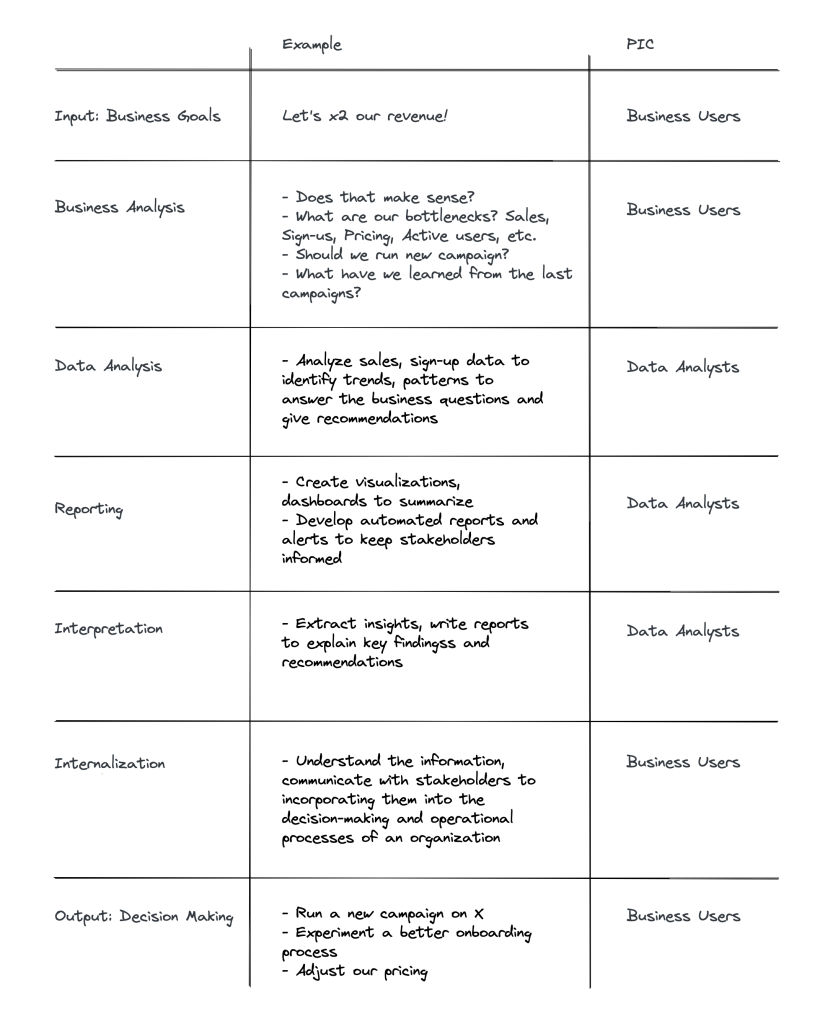
In this BI workflow, the Customers are Business Users, and the Service Providers are Data Analysts.
Caveat: (1) This workflow is not always linear and the output may generate new questions and inputs. (2) Some BI venders also provide data preparation or collection capabilities, which also have their own self-service solutions, where Service Providers of Data Analysts could be Analytics Engineer or Data Engineers. However, I will focus only on the reporting and analysis components.
The problems between its Service Providers and Customers
Because data teams lack business context and business users lack technical knowledge, they must communicate with business users back and forth in order to translate business requests into something quantifiable.
Effective coordination between the two parties is critical for this flow to run smoothly.
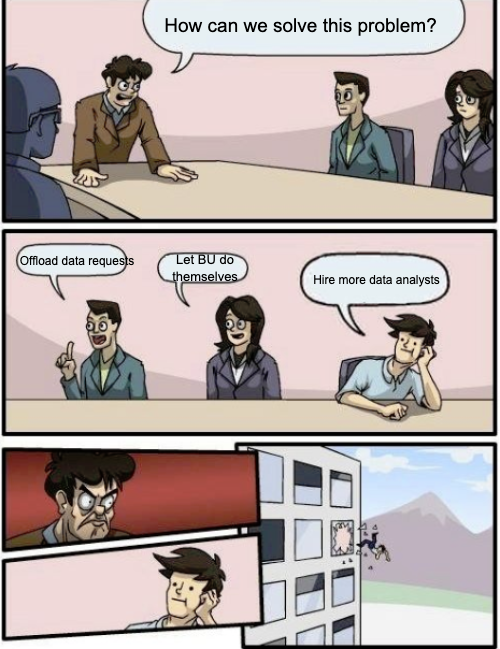
However, as businesses expand, the number of data requests grows, leading to an increasingly complex back-and-forth dependency between the service providers and the customers.
- Data teams become fatigued by repeated or low impact requests from business users
- Business teams are frustrated because it takes so long to get answers that aren’t even close to what they want
“if you’re just dealing with ad-hoc requests – you’re dealing with like “hey I’m interested in XYZ, can you pull this data for me” – there’s no work being done.“
Michael Han – Head of Data at Spenmo, How Spenmo Successfully Builds A Self-service Culture
And Self-service BI was born
“Better coordination was the wrong answer …
At last we realized that all this cross-team communication didn’t really need refinement at all —it needed elimination …
In my tenure at Amazon I heard him (Jeff Bezos) say many times that if we wanted Amazon to be a place where builders can build, we needed to eliminate communication, not encourage it”
Bill Carr and Colin Bryar – Working Backwards
What if we use a tool that is easy enough for business users to use, we can offload these requests to them, we don’t have to worry about low-impact requests, we don’t even need to communicate, and we can provide faster access to data for them at the same time?
This is how Self-service in BI becomes a viable option.
Self-service BI means allowing business users (customer) to answer data questions without requiring assistance (or minimal) from data teams (service provider).
Sorry, but SSBI (or buffet) is not about democracy
Although SSBI can enable democracy, its original purpose is about cost and operations optimization, not democratization. If we imagine that data analysts are cheap/free, can understand the business context, and can answer any question in under 10 seconds, what are the reasons to adopt a self-service BI tool?
The current implementation of Self-service BI
To be able to answer questions using data independently, one must have a certain level of technical and analytical ability, which I refer to as Data Literacy.
The higher their level of data literacy, the more complex and impactful questions they can address.
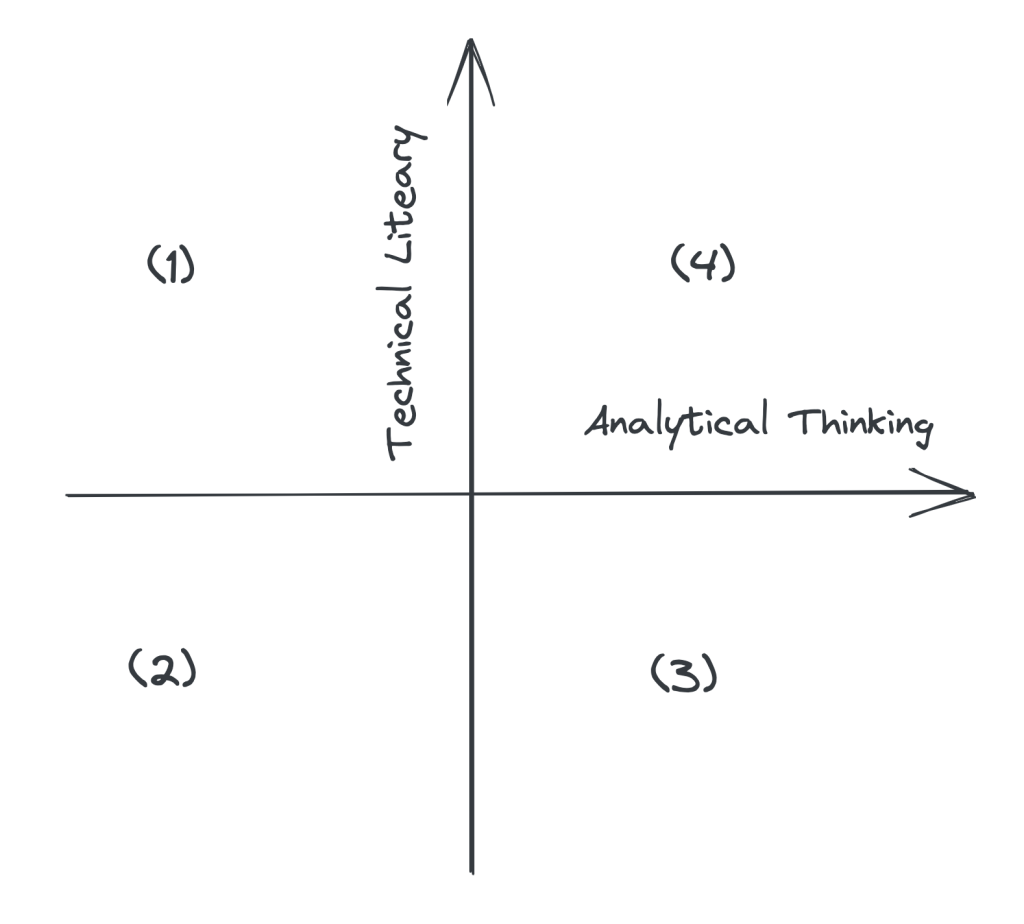
- (1) “I know SQL, R, Python but I can’t ask any impactful questions for my business”
- (2) “I don’t need data to make decisions”
- (3) “I can ask high-impact questions, but I rely on data team because I don’t know how to get data to support my questions”
- (4) “I can ask high-impact questions, answer myself using data, and use them to support business decisions”
To enable business users to answer data questions without relying on data teams, we must either improve their data literacy or find a solution that bridges the gap.
The analytical thinking gap
Analytical thinking in data analytics involves breaking down complex problems, using critical thinking skills to better understand them, and finding potential solutions through data.
Using the above example of “Let’s x2 revenue,” analytical thinking means being able to validate the question, identify factors and sub-factors that impact the question, break them down into quantifiable metrics, and form actionable hypotheses and strategies.
Perhaps closing the technical gap is difficult enough, I haven’t found any BI solutions that attempt to do so. Improving thinking is always a challenging topic, though.
A more common approach is to learn from other people, industry, courses, or through internal training.
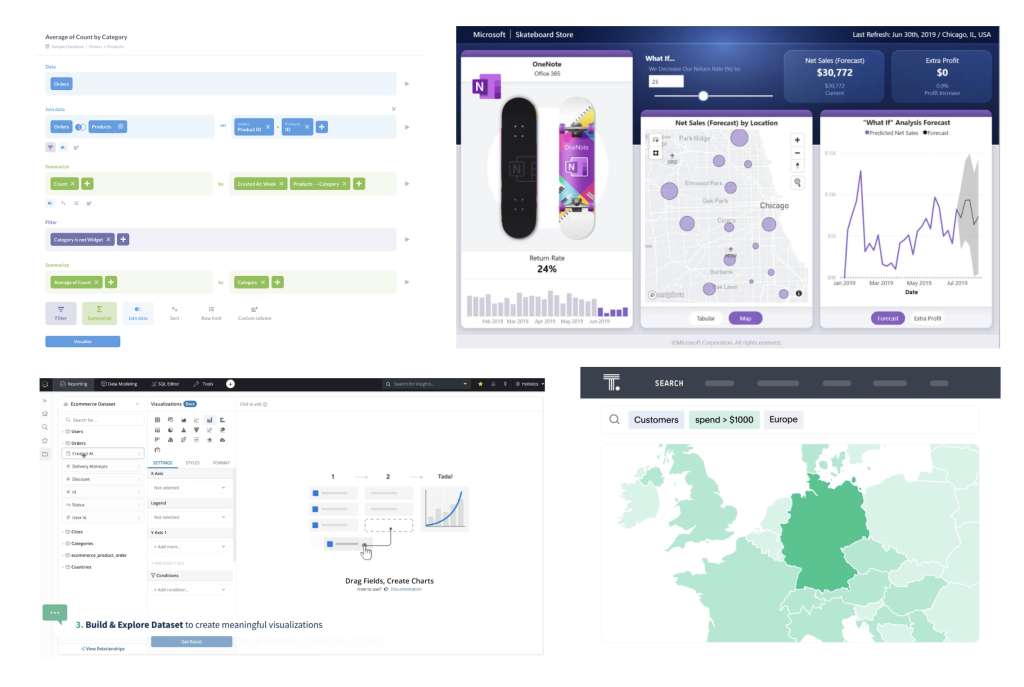
The technical gap – Where SSBI Tools are innovating
Business users are typically not trained to communicate with databases using query languages. Therefore, we must either provide training in SQL, R, Python or offer simpler alternatives for them to learn.
This is where self-service BI tools jump in to bridge the gap between business user’s mental model with the database by introducing a new conceptual model (a friendly user interface).
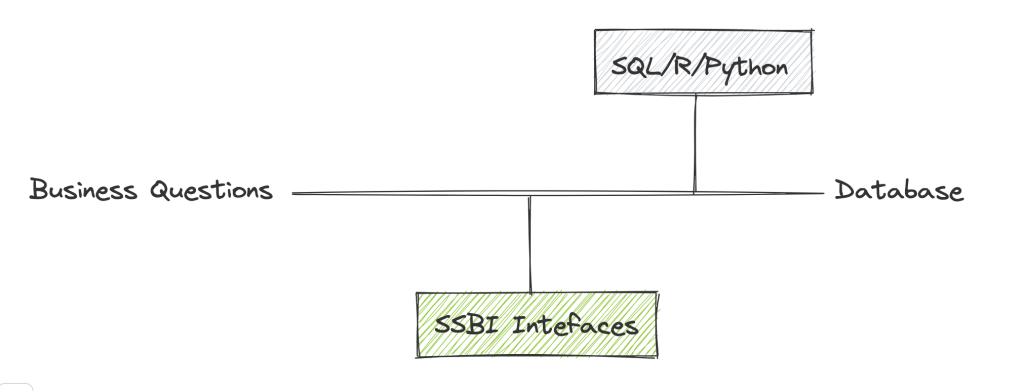
It comes in a variety of forms, including a SQL builder, drag-and-drop interface, question interface, and interactive dashboard, etc.
The emerging challenges of SSBI
Any new solution always will bring out new problems (Problem Solution Co-evolution), so does SSBI. Here are a few common challenges
Data quality and governance: If the data are not properly governed, data generated from business users may be inaccurate or inconsistent, which can impact business decisions and outcomes.
Security risks: Users may be able to access sensitive or confidential data without proper authorization or protocols in place.
User adoption: Ironically, while SSBI aim to be easy for everyone to get data, it can be challenging to adopt and use effectively, particularly for users who are not highly technical or data-savvy.
According to my observations, user adoption is the most difficult one because the technical gap remains, and analysis is not the responsibility of business users by default. Some data teams are able to develop data literacy through training and documentation, while others end up building most of reports for their users again.
The future of Self-service BI
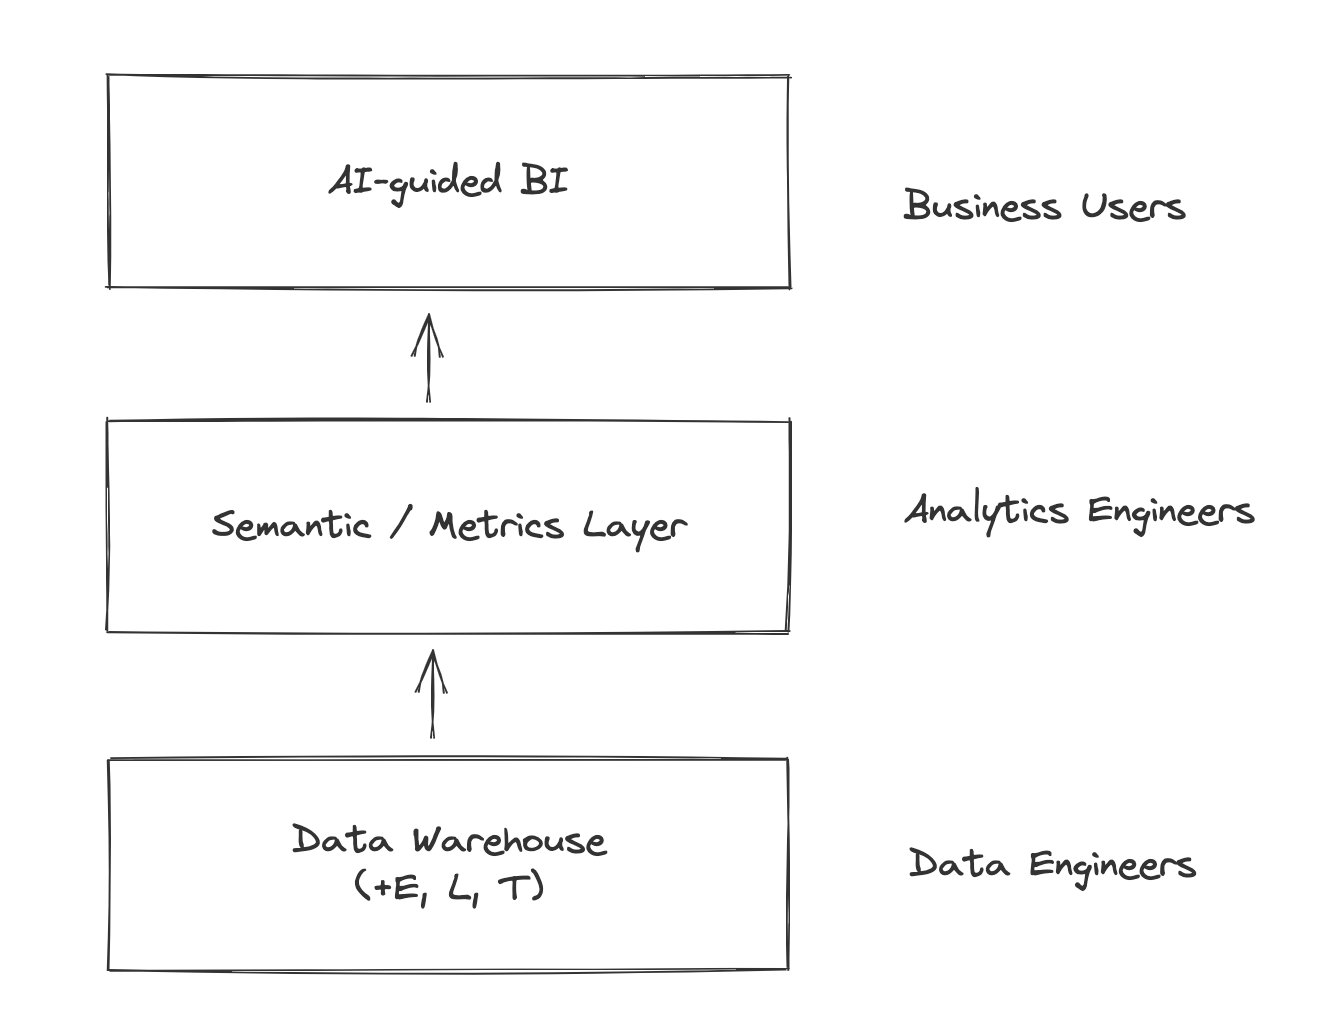
I envision that a new generation of self-service BI will emerge, which overcomes all the challenges mentioned above and disrupts existing solutions by incorporating the two key components: AI-guided Interface and Semantic Layer
AI-guided Interface
Regardless of the existing solution, the technical gap still remains, as business users must learn to translate their questions to an interface that can answer them.
People with low technical literacy may not even understand what “Count Id” means, or what dimensions and measures are, or even some specific terms such as MRR. “What are the top five cities with the highest revenue in the last year?” is all they know.
Thinking in first principles, business users’ job is not to drag and drop, but to get the answers that support their decisions. They should not even have to think about how to translate business questions into data questions; they should simply ask and receive answers.
With the advent and rapid development of LLM and ChatGPT recently, it is now more possible to translate business questions directly into data queries, and close the the gap entirely.
More than that, it can assist people with brainstorming, which also helps with the previously mentioned analytical thinking gap.
Consider the following conversation, assuming the chatbot has access to your company’s data and wiki
- 👶 User: If I want to double our company’s revenue, what areas should I look into?
- 🤖 AI: To double your company’s revenue, you could consider focusing on the following areas: Sales, Conversion Rate, Activation Rate, Retention Rate, LTV, Expanding product offerings, Entering new markets, Changing pricing strategy
- 👶 User: Extract the Conversion Rate
- 🤖 AI: I’m sorry, could you please provide me with more context? Which conversion rate data are you referring to? Additionally, what do you plan to use the conversion rate data for? Currently, we have already these predefined these metrics: Landing to Sign-up Conversion Rate, Sign-up to Paid Conversion Rate.
- 👶 User: Show me the Landing Sign-up Conversion Rate
- 🤖 AI: Our average Landing to Sign-up Conversion Rate last 3 months is currently 5%, which is lower than the benchmark rate of 15%. By increasing the conversion rate to 12%, you have the potential to double your revenue
- 👶 User: Provide me with a breakdown of our conversion rate over the past 12 months, organized by city?
- 🤖 AI: Here is the breakdown of our conversion rate over the past 12 months, organized by city. As you can see from this line chart, we have data for three cities: San Francisco, New York, and Seattle. The chart shows the monthly conversion rates for each city from January 2022 to December 2022
In San Francisco, the conversion rate started at 5.0% in January 2012, decreased in February and March, and then increased gradually before peaking at 5.8% in December 2012. In New York, the conversion rate started at 4.8% in January 2012, increased and peaked at 5.6% in September 2012, and then fluctuated between 5.2% and 5.6% until December 2012. Finally, in Seattle, the conversion rate started at 4.2% in January 2012, increased and peaked at 6.2% in November 2012, and then decreased to 5.4% in December 2012.
Overall, we can see that Seattle had the highest conversion rate among the three cities, with a peak of 6.2% in November 2012. San Francisco had a gradual increase in conversion rate over the year, while New York had a more varied trend, with an initial increase followed by fluctuations in conversion rate. This data can help us identify areas where we may need to focus our marketing and sales efforts to improve conversion rates in specific cities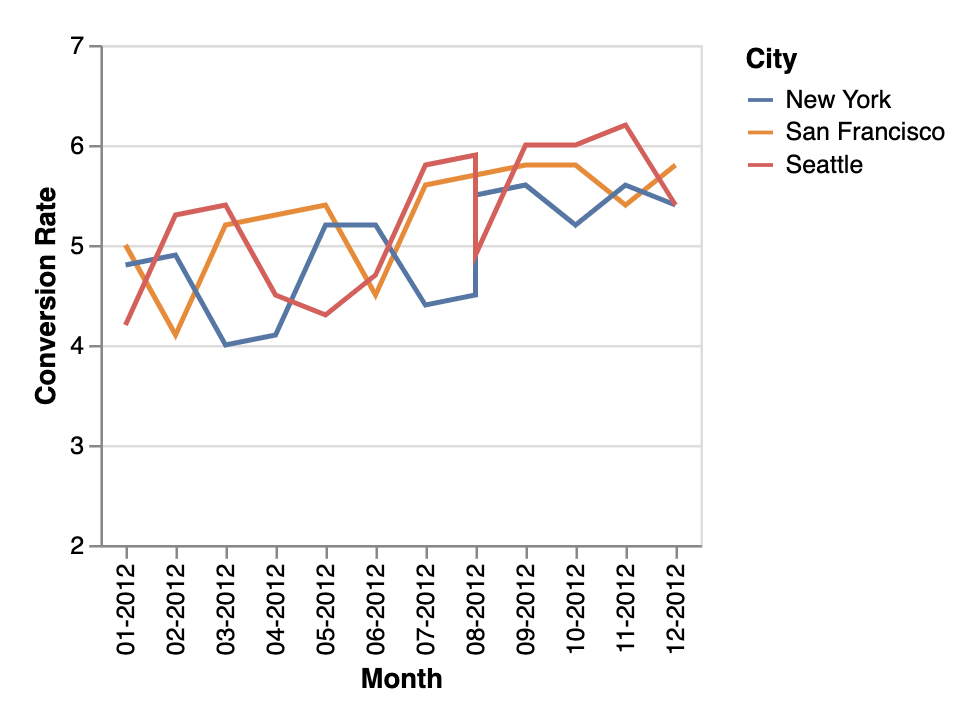
- 👶 User: Add this chart to my dashboard “My KPI” and set up a daily alert to be sent to me via Slack
- 🤖 AI: Sure, I have added the chart to your dashboard “My KPI” and set up a daily alert to be sent to you via Slack. You will receive a notification every day with the latest conversion rate data for San Francisco, New York, and Seattle. If you have any questions or would like to make any changes to this setup, please let me know.
Note: This is only an example of how an AI chatbot can help bridge the technical gap. This is not to say that analytics should be done entirely on a conversational interface. Conversational UI is not always optimal or usable; to utilize AI, the UI will require some innovations, which I will discuss in greater detail in another essay.
Semantic layer will be the answer to governance, standardization, security
While not a new concept, the semantic layer has gained traction in the data industry recently, with popular data players such as Looker, Holistics, and dbt investing in this area.
It maps complex data into familiar business terms like product, customer, or revenue for a unified view across an organization, allowing quick mapping of different data definitions for analytics and other purposes
This enables data teams to confidently control consistency, governance, and permission while distributing SSBI.
If you want to dig in further, follow the links below
- LLM is not enough (for self-service analytics)
- The Rise of the Semantic Layer: Metrics On-The-Fly | Airbyte
- How Would An Ideal Semantic Layer Look Like? (dbt Singapore Meetup) | Holistics
- The missing piece of the modern data stack
- Dbt Labs acquires Transform, adding semantic tools to its data analytics platform | TechCrunch

Most Data Analysts will have to change their role

The two primary roles in this workflow will be Business Users and Analytics Engineers.
Analytics Engineers will ensure data truth, governance, permission, and reliability, as well as distribute unified metrics and logic to business users.
Business Users with business context and an analytical mindset will be able to ask and receive responses directly from the AI chatbot.
Data Analysts will have to choose between expanding their business knowledge and becoming product, marketing, or sales analysts, or becoming analytics engineers.
What does this mean for the BI tool market?
Updated on 2023, May 13th
Customers will go from “Wow, you have NLP, that’s cool” to “It would be a disappointment if you don’t have NLP or ChatGPT integration”. (Yes, this is already happening from our customer conversations)
AI-guided interfaces will be the new normal, tools without NLP need to find a way to integrate with it, while tools marketed with NLP as differentiators must offer more than just NLP capabilities.
And tools equipped with a robust semantic layer will have the opportunity to take the lead in this wave.
With these two components, AI-guided Analytics Interface and Semantic Layer, data teams will be able to deliver a more reliable and governed self-service experience for business users.
It could happen and become a table stake sooner than we think, as companies have been proactively investing in it. (I can even build a web app to generate charts from prompts in 2 days despite not knowing how to code.)
While this appears to be an ultimate solution, new solutions create new challenges inevitably.
- The AI-guided interface must be flexible enough for users to customize and support exploratory use cases
- The process must be transparent for debugging
- The integration between the two layers has to be seamless
- The LLM should connect with company knowledge including business terms, business logics, etc.
- The semantic layer also comes with maintenance, performance, quality challenges
- and more
Whether it’s built upon established platforms or through the emergence of new players, there’s no denying that there is still much work to be done. As someone who is building BI products, I’m more excited than ever about what the future holds.
Other references
Be the first to reply