


Recently there has been a lot of excitement around the idea of a stand-alone metrics layer in the modern data stack.
Traditionally, metrics have been defined in the BI or analytics layer where various dashboards are used to look at business metrics like Revenue, Sales Pipeline, numbers of Claims, or User Activity. Given that most organizations end up with multiple BI/Analytics tools, the idea has a lot of merits. Instead of pulling data into excel sheets and expecting everyone to calculate metrics independently, why not define the metrics in one central place for all to refer to? In software engineering, it is a classic candidate for refactoring the repeated definition of the same logic and following the principle of “Do not Repeat Yourself” DRY.
However, refactorings are not always easy. If you don’t know the full scope of how your code is being used (or going to be used) you can end up with a lot of empty promises and entangled code. When you are refactoring for eliminating duplication, the trick is to make your abstractions clean enough that the common parts can be expressed in one place, but the parts that vary in different places can be supplied as additional details as needed. For design pattern enthusiasts, this is probably closest to the Strategy Pattern. The same can be said for the metrics layer.
Having deployed ThoughtSpot in hundreds of enterprises and startups, we have learned a lot about what different businesses need from their analytics solutions in different use cases. Whether banks reducing fraud, retailers optimizing inventory, manufacturers improving the supply chain, hospitals enhancing outcomes, or cancer researchers understanding their data, the metrics people care about in the real world are quite varied and require careful design.
The six metrics classes
Simple aggregations: These are things like Sum(Revenue), Average(Price), Count_Distict(Users). They are really easy to define and an isolated metric definition layer will do a good job of defining these.
Aggregation with scalar functions: Similar to simple aggregations above, but with additional mathematical operators. For example, Profit may be defined as sum(Revenue) - Sum(Cost) - Sum (commissions). Alternatively, you may need some transformations at the row level such as Sum(Revenue_in_local_currency * USD_Conversion_rate).
Metrics that require joins: The simplest example can be a version of Revenue calculation where conversion rates change daily and you have another table that stores conversion rate in a dimension table. Now Revenue definition becomes Sum(Revenue_in_local_currency * conversion_rate(local_currency, transaction_date)). Here conversion_rate(local_currency, transaction_date) is a column from another table that needs to be brought in by joining on local_currency and transaction_date from the fact table. You could bypass the join requirement by defining a denormalized view, but views bring in other issues such as requiring all joins to be executed.
Metrics with window functions: Things like Moving Averages, Cumulative Sum, or any kind of aggregation in data that represents a time-series or sequence of events that you need to aggregate on a window around current time falls in this group.
Metrics with multiple aggregation levels: This is a special class of metrics that often represent ratios. For example, if you want to define the Market Share of a product in its category, you first have to sum up Revenue grouped at the Product level, then you want to sum up Revenue at the Product Category level, combine the results and then compute the ratio. In addition, if you want to observe Market Share across years then you need to include Year(transaction_date) in the grouping column both for numerator and denominator. So the grouping becomes dynamic. These metrics are handled differently in different BI products. For example, this would look like a Group Aggregate Formula in ThoughtSpot, in Tableau, they are called Level of Detail (LoD) Functions.
Multi-fact metrics: Sometimes, your metrics span multiple fact tables that may or may not have a direct relationship with each other. For example:
a. Sales Fact and Bulk Purchase Fact for a retailer to calculate Profit Margin.
b. Services Provided, and Insurance Coverage for a hospital to calculate the profitability of different services.
c. Bank Statements, Credit Card transactions, and Credit History for a Bank to figure out default risk.
Back in 2015 when we started looking at these kinds of metrics, to our surprise we found that they were not handled correctly in any of the BI tools we looked at (and I believe that is the case still). Most BI tools default simply to joining the tables and aggregating the rows of the joined table, which in the case of many-to-many join would cause the same numbers to be double-counted and give incorrect results. Getting these metrics requires being able to aggregate different fact tables to a granularity that joining the results makes sense and then post join, re-aggregate them. Legacy BI tools have two major issues here. They either couldn’t get to the level of granularity of data needed or required customer SQL, which is hard to maintain and limits the level of interactivity that can be built. Nevertheless, they do cover an important segment of metrics that a lot of businesses care about.
Where to define metrics
As you can see, defining metrics is not always just a matter of defining a mathematical formula or stand-alone SQL fragment.
If you look at a typical analytical tool, you can view them as a three-part stack: logical modeling (Semantic Layer), query generation, and interactive data visualization and exploration.
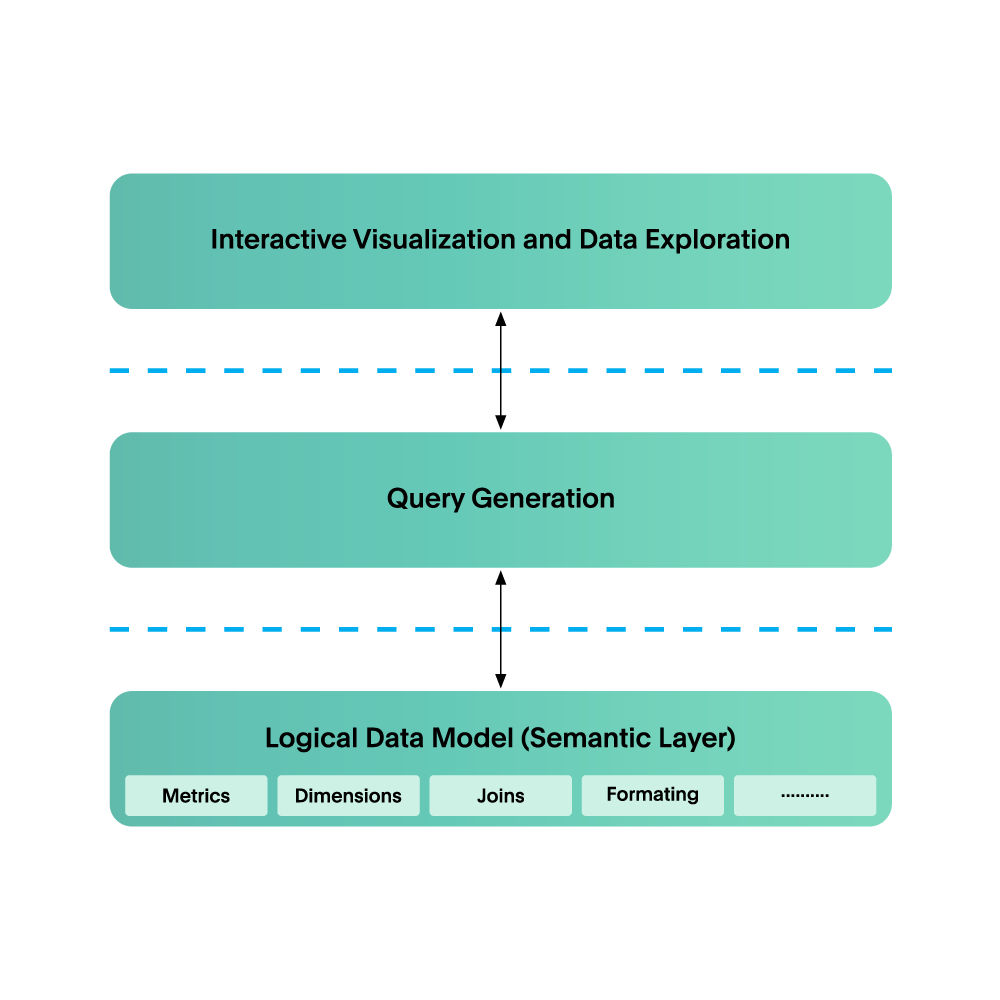
The logical modeling layer is where you start assigning business context to raw data that exists in tables and columns. The purpose of defining a logical data model is so non-technical business users can express business questions in business terms, read charts and tables more easily, and interact with data visualizations.
For example, you may start at “Top 10 products by revenue” and then drill down into the revenue generated by the top products by country. Typically, the kinds of things that you specify in a logical data model are:
Business names for column (rev_txn_usd -> Revenue)
Whether a column is a Metric (Measure) or Dimension (Attribute). For example, Revenue is a Metric, but Age or Customer Name is a Dimension.
Joins: Exactly how to join tables (which pairs, join based on what join conditions, and whether it’s an inner join, outer join, or some other kind of join) and whether it represents a many-to-one, one-to-one, or one-to-many relationship.
The query generation layer is where user intent is transformed into the appropriate SQL or equivalent to generate the data visualization or answer the user’s questions. If you think of BI as just a way of slicing and dicing metrics in a denormalized table, then it can be a pretty simple thing to do. But in reality, this component needs to cover a lot of ground and do a lot of heavy lifting. More on this later.
Finally, the interactive data visualization and exploration layer is where the business user will ultimately spend most of their time. Whether they’re looking at a dashboard, using drill-down or other exploration interaction models to ask deeper questions, or asking a completely new question through a search-like interface.
Making space for a common metrics layer
If we are going to refactor the stack to make space for a common metrics layer, there are a few choices to make about what part of this stack goes into the refactored component. We don’t want the top layer in there otherwise it will be just another BI tool competing with the rest. That leaves us with three choices:
Encapsulate the metric definition
Encapsulate the entire semantic layer
Encapsulate both the semantic and query generation layers
There have been many proposals around all three versions of a metrics layer, each with its own unique tradeoffs. Moving down the list from one to three, there is increased complexity both in implementation and deployment - but there is also potential for an increasingly more powerful combined stack.
Possibility #1: Encapsulate the metric definition
This is good for metrics that are simple aggregates with scalar functions (type 1 and type 2), but will not be able to handle anything else. In my experience, this is where most of the implementations of the metrics layer are (I have not looked at every implementation, but I’d love to be surprised).
Possibility #2: Encapsulate the entire semantic layer
This gets a lot more interesting. In this case, the metrics layer would not just be aware of metrics, but also, tables, joins, and dimensions. This allows you to have both complete data models and the ability to define expressions across multiple tables. You can also define metrics that may traverse multiple grains of aggregation. This would be a huge step forward in defining metadata in a common layer.
However, this requires having a standardized common modeling language that can be understood by different consumers that can encapsulate definitions of joins, metrics of all types above, and dimensions. It also leaves the query generation layer to be implemented independently in each of the consumers.
Possibility #3: Encapsulate both the semantic and query generation layers
In my opinion, this is the most powerful iteration of a metrics layer. Most BI tools today differ heavily in what type of metrics they can or cannot support. There are also subtle differences in how they generate queries for different types of metrics. In an ideal scenario, the metrics layer will encapsulate query generation as well. This however creates a new requirement: defining a new standard interface between the interactive visualization layer and the query generation layer.
It’s easy to think the query layer should be SQL, but I don’t think it’s up to the challenge. SQL is designed to be precise in how things are joined, in what order, and where the aggregation happens. What we need is a language that expresses a business user's intent, and combines the intent with predefined data models to generate queries where the same data model could generate very different queries with very different join structures, a different subset of tables, and different ways of aggregating measures.
The future of the metrics layer done right
I think encapsulating both the semantic and query generation layers is the real deal - and finally possible. That’s what gets me so excited about the future.
We like what dbt is doing here. Starting in dbt v1.0, you can define some types of metrics in your models alongside the rest of your existing transformations. Later this year, we may have an integration where ThoughtSpot can read metric definitions from dbt and integrate that into our modeling layer which will be a win for our joint customers. But this integration does not describe what I am talking about in this post. A rich, independent metrics layer that can encapsulate both logical modeling and query generation, with an open standard for consumption layer is yet to be designed and built.
If you are excited about this too, I’d love to hear from you! In fact, if you want to collaborate on an open language for defining a semantic layer and a query language that can capture query intent while decoupling the information already defined in the semantic layer, I would love to buy you coffee. Or at the very least have a stimulating conversation!
If we as an industry are going to refactor this stack, let’s do it right. We don’t get too many shots at asking everyone to keep changing how the stack works.


